

GatsbyJS Performance Audit
- by Colin on 8-6-2021


I’ve been looking forward to auditing this blog. It’s easy to forget or underestimate all the juicy goodness GatsbyJS is doing straight out of the box. (Have you tried the new gatsby-plugin-image yet? If not see this post). GatsbyJS provides many incredible features, and it’s easy to implement powerful things without appreciating what’s going on underneath. An audit offers an excellent opportunity to learn and understand more about how and why GatsbyJS is so effective.
Testing & Measuring
Testing code and measuring performance is complicated, there are plenty of pitfalls. I found Sam Bhagwat’s (co-creator of GatsbyJS) talk at GatsbyConf2021 very helpful and a great place to begin getting started auditing a Gatsby site.
https://www.youtube.com/watch?v=x4RfrJiIzBE
This article is also super helpful.
https://www.gatsbyjs.com/docs/how-to/performance/improving-site-performance/
Red Faced 🥵 😳🥵 😳😡🤬
In my opinion, if a GatsbyJS site isn’t getting all greens using Google lighthouse, then there had better be a good excuse! How red was my face when I saw the lighthouse scores for my site!? 😡🤬🥵


It was disappointing and a little frustrating considering that I had updated to GatsbyV3 and configured the new Gatsby Image Plugin. Unfortunately, these scores are not much better than V2. The Lighthouse results are marginally better when I run them from my Browser, but 80 is still low.


Aside – Notice how the SEO scores have gone from an orange 85 to green 92? This is because Gatsby Cloud (and Netlify) don’t index their preview builds, which is the environment providing the Lighthouse result. The latter Lighthouse result is from Chrome run on my machine.
Aside II – The environment, where the lighthouse test is being run, and the website being tested make a difference!
- Browsers with the React Devtool Extension installed and activated will be severely impacted.
- Testing a development environment on localhost:8000 will be severely impacted.
- Built sites via Gatsby Serve at localhost:9000 won’t be served as HTTPS (unless configured to) which will also constrain overall scores.
These are but a few examples, it’s worth remembering that the environment running the lighthouse tests plays a part in the results.


Make sure you inspect results diligently or you may end up trying to remedy something that isn’t a problem.
Caught Red Handed
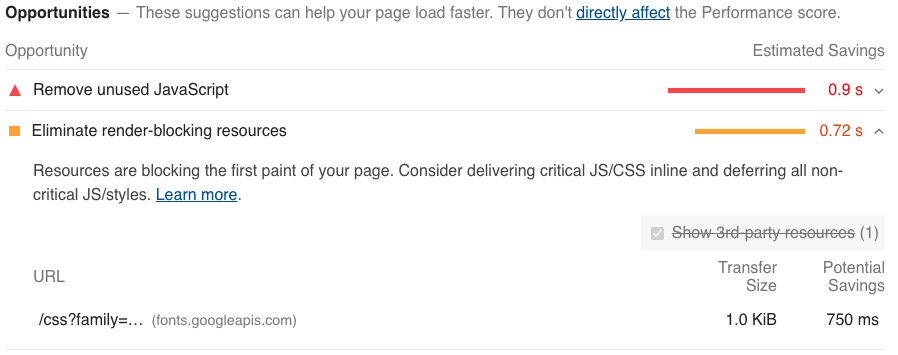
One of the first lighthouse suggestions is to pre-load the font. It’s crucial that the site is being cached properly. Asset and caching problems are simple to solve with GatsbyJS but also easy to miss. In this case, I am using TypographyJS which uses the Google Font CDN. With this feature turned off fonts can be configured to prefetch using the gatsby-plugin-webfonts plugin.
The Curious Case of Largest Contentful Paint (LCP).
I had long suspected the reason for the low scores on the home (“/”) page performance reports were partly due to using React-Spring to (crudely) “animate” page transitions. This included a particularly garish looking swoop on the landing page! See the link below for a similar-looking demo.
Lighthouse reports on pages without the animation transitions seemed to consistently score higher. This was all the evidence needed to put a plan into action. Remove the “Swoop” animation. Then align and centre the Hero image content.
Aside – Google are going to measure many pages to decide on a ranking score.
Potential Pain Points
There are also a number of small but potentially harmful React-Spring animations site-wide.
- The Hamburger Menu/Toggle.
- The Theme Toggle Icon. (Season (dark) Mode)
- There are some pages (Including the home page) where text is animated. As if being written to the screen.
- CSS background opacity animation.
CSS Animation
I am using CSS animation to change the background gradient of the different themes. This is somewhat of an illusion as they are animated into each other via opacity.
Furthermore, to minimise a Flash Of Unstyled Content (FOUC) and correctly hydrate the initial render, a script on page load checks Local Storage for a previously selected colour theme to set the CSS variables correctly.
https://www.joshwcomeau.com/react/dark-mode/#introduction – This article explains the problem, and solution very eloquently. Many thanks to Josh. A particularly interesting read into SSR.
Rendering Performance.
Put simply, the opacity + translateZ are the cheapest properties to animate. All of the animations utilised on this site follow this rule except for text background-color and text color when a theme change is triggered.
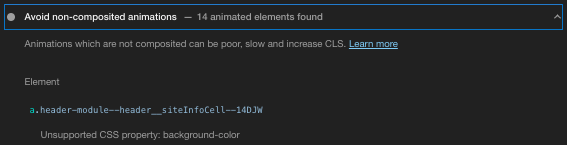
Lighthouse does flag where this particular rule is being broken.
To find about more about rendering, I found the resources below to be very helpful.
https://developers.google.com/web/fundamentals/performance/rendering
https://www.html5rocks.com/en/tutorials/speed/high-performance-animations/
This short video also provides a good explanation and demonstration of some of the issues.
https://www.youtube.com/watch?v=N5EW4HnF6FU – The Only 2 CSS Properties You Should Animate *
There is also a free course from Udacity: Browser Rendering Optimization. I’ve only completed a couple of modules but would highly recommend trying it out if you’re interested. It’s also available to watch on Youtube, but the experience on the Udacity platform has interactive quizzes!
https://www.udacity.com/course/browser-rendering-optimization–ud860
Moment Of Truth
Having removed the “Swoosh” animation and correctly configured the pre-loaded fonts. The moment had come to upload the changes to Gatsby Cloud… This is the first lighthouse report provided by Gatsby Cloud at build.

Unfortunately, the initial result did not look too pleasing, 70 on performance seemed like a negative… Though higher than the previous 57 issued by Gatsby Cloud. To be clear, this update fixes the font caching and also removed the initial home page transition animation.

However, looking closer at the report reveals that none of the caching is working properly. I suppose this is because the site was rebuilt with a completely fresh cache and resources haven’t been cached.
Aside – “Serve static assets…” warnings will negatively affect and “bottleneck” the main-thread. A snowball effect.

Local Report
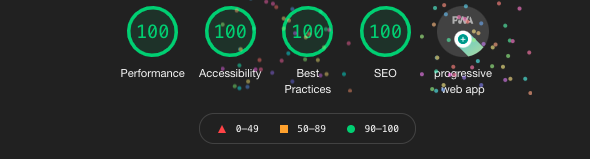
When running Lighthouse locally from my live site, using simulated throttling the result is perfect 100’s. This is more like what we want to see! Admittedly, this wasn’t the first report but I thought I may be close. I estimate that 1 in 4.5 reports gets a perfect score. (Note, this was nearly a month ago, it doesn’t seem to be as performant now. I’ve been tinkering…)
It’s particularly satisfying considering there are React-Spring and CSS based animations. Including animated text and SVG as well as non-composite animations. I’m sure these could be optimised further, some of the implementations are not so brilliant. There’s also a check on Local Storage and global context. Fortunately, I didn’t have to go looking in the Webpack bundle to trim scripts or re-organise templates.
A Smooth Criminal?
I wanted to find out if the react-spring animations performed differently depending on their configuration. As the library provides physically modelled animation it offers some interesting advantages to traditional duration based animation. One use-case is that it may improve responsivity to user interaction.
I wanted to test if the duration increased the damage to performance. I have however configured three different types of animation to try out. All the Lighthouse reports shown below were made within a few minutes of each other.


It’s wildly unscientific, but the initial results are interesting.
- The fastest animation of the three consistently performs better than the others. Often it performs better than the report shown above.
- The animation time/duration does seem to decrease performance scores, though the results above don’t show it.
- According to my (unscientific) average, the slow animation performs better than the Wobbly.
- The wobbly animation lasts considerably longer, yet some reports show a close result. (As above, though I suspect this was chance.)
- On my (unscientific) average, the Wobbly animation performs the worst.
It is interesting that such a wild animation, as seen in the wobbly variant doesn’t score much less in comparison to the other slow animation.
Case Closed!?
Unfortunately, it’s not quite so elementary. As Sam explains in the talk that I linked to earlier, site performance is similar to health. An athlete needs to keep training to maintain their current fitness. It seems that since writing this post and publishing that site’s lighthouse scores are not as they once were…
It also feels like a bit of a cheat. To improve the score I have removed a “fancy” animation, what if removing the animation wasn’t an option? It’s something I hope to come back to once I’ve finished the Browser Rendering Optimization course. I have a couple of hunches regarding how to improve the animation.
Google & Core Web Vitals
It’s well worth noting that from May 2021 Google is changing how it ranks pages, with a greater weighting on performance and core web vitals. Better performing websites will rank higher, the perfect excuse to start auditing your own site today!
I found this webinar very helpful for learning about Gatsby specific issues and how Google are updating their ranking mechanism alongside Lighthouse.
Webinar | Understanding Google’s Core Web Vitals Search Update with Gatsby & Yoast
https://www.youtube.com/watch?v=s44PoOCwjYQ
The two videos below (Thanks to the presenters) are also amazingly helpful.
Common Mistakes That Degrade Frontend Performance
https://www.youtube.com/watch?v=uVrp_A7rj_I
“Why Can’t I Get 100 on Lighthouse?”
https://www.youtube.com/watch?v=hRfOQV2Gotc
Lighthouse Testing Takeaways
Testing and measuring the performance of any software is challenging, runtime environments are variable. It is easy to misread or misunderstand diagnostic results. Ensure that unusual looking results are not due to incorrectly cached data or fundamental environment issues. Carefully read lighthouse reports to evaluate where time is best spent on improvement.
Future Improvements
I am currently experimenting with the plugins,
gatsby-plugin-webpack-bundle-analyser-v2 && gatsby-plugin-perf-budgets
The gatsby-plugin-perf-budgets is particularly interesting and provides a clear analysis for every page bundle generated. I’m hoping to make improvements to the bundle sizes via more efficient page templating and demonstrate using some kind of lazy-loading solution. This is going to be the subject of a future blog post. Thanks for reading!